


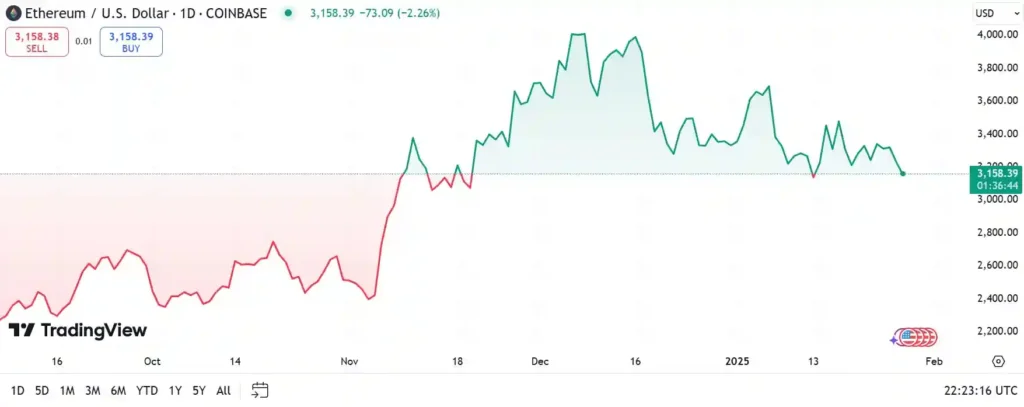
Ethereum (ETH) has experienced a 7% drop in the past 24 hours, with bearish momentum suggesting a possible further decline below the critical $3,000 support level. The recent “death cross” in ETH’s Exponential Moving Average (EMA) lines indicates a strengthening downtrend as sellers gain control.
Downtrend Signals
The Directional Movement Index (DMI) chart for Ethereum shows that the Average Directional Index (ADX) has surged from 10.2 to 21.5, highlighting an increase in trend strength after a period of low momentum. An ADX value above 20 indicates that ETH is moving away from sideways action toward a more defined trend.
The bullish pressure, represented by the +DI, has significantly dropped from 19 to 10.9, while the bearish pressure, indicated by the -DI, has risen from 21.2 to 38.4. This shift confirms that sellers are now in control, pushing ETH into a clear downtrend. The combination of a rising ADX and stronger bearish pressure suggests the potential for further downside movement in ETH’s price.
Whale Activity and Market Impact
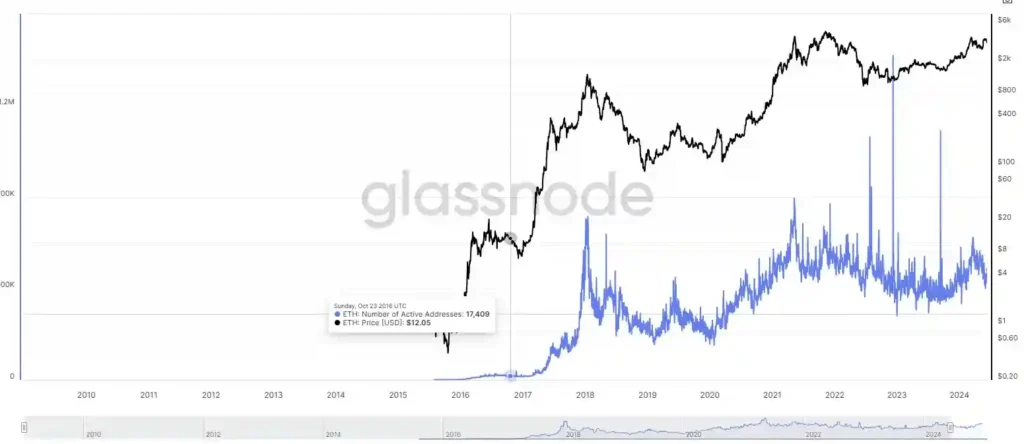
Despite the current downtrend, whale addresses—wallets holding at least 1,000 ETH—have started to recover after a decline earlier this month. The number of whale addresses dropped from 5,690 to 5,663 between January 15 and January 19. However, the count has since increased to 5,685, indicating a high concentration of whale activity.
Tracking whale activity is crucial, as their movements can significantly impact the market. The current level of 5,685 whale wallets suggests strong accumulation among large holders, often reflecting confidence in ETH’s long-term potential. This recovery in whale activity could indicate increased buying interest, potentially supporting Ethereum’s price stability or signaling bullish sentiment in the market.
Future Price Predictions
ETH’s EMA lines revealed a death cross yesterday, signaling bearish momentum. With a 7% drop in the past 24 hours, Ethereum’s price could test the support level at $2,927. If the downtrend continues, further downside could push ETH to $2,723 or even $2,358, marking its lowest level since early November 2024.
On the other hand, if ETH manages to regain positive momentum and reverse the current trend, it may test the resistance at $3,334. Successfully breaking this level could pave the way for further gains, with potential targets at $3,473 and $3,745.
Conclusion
Ethereum’s current bearish momentum and the recent death cross in its EMA lines suggest that sellers are in control, with the potential for further downside. However, the recovery in whale activity and the possibility of a trend reversal provide hope for a recovery. Investors should closely monitor key support and resistance levels to navigate the current market dynamics.
Disclaimer: This price analysis article is provided for informational purposes only and does not constitute financial, investment, or legal advice. winningfinder does not endorse any cryptocurrency or investment opportunity. Market conditions are subject to rapid change. Always conduct your own due diligence and consult with a qualified professional before making any investment decisions.
